
What does the research show?
Nashville's luxury market is giving detached-home sellers and attached-home sellers different signals. In the Institute for Luxury Home Marketing's September report, the single-family segment remained balanced, while the attached segment fell into the report's buyer-market category. The difference becomes clearer when the underlying counts are examined instead of relying only on the labels.
The report covers single-family homes priced at $900,000 or more and attached homes priced at $500,000 or more. These are the Institute's separate luxury thresholds. They do not represent a comparison of identical price brackets.
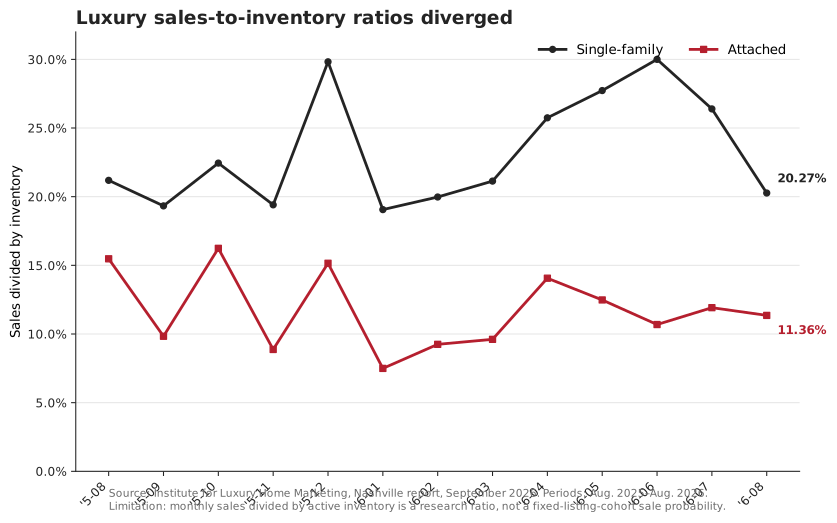
The 13-month counts behind the chart
Every ratio below divides that month’s sales by its reported inventory. Single-family starts at $900,000; attached starts at $500,000. Seasonal movement is visible, and the different thresholds prevent a matched-price comparison of the property types.
| Month | Single-family inventory | Sales | Ratio | Attached inventory | Sales | Ratio |
|---|---|---|---|---|---|---|
| 2025-08 | 1260 | 267 | 21.19% | 491 | 76 | 15.48% |
| 2025-09 | 1283 | 248 | 19.33% | 488 | 48 | 9.84% |
| 2025-10 | 1292 | 290 | 22.45% | 505 | 82 | 16.24% |
| 2025-11 | 1113 | 216 | 19.41% | 462 | 41 | 8.87% |
| 2025-12 | 902 | 269 | 29.82% | 396 | 60 | 15.15% |
| 2026-01 | 850 | 162 | 19.06% | 427 | 32 | 7.49% |
| 2026-02 | 866 | 173 | 19.98% | 465 | 43 | 9.25% |
| 2026-03 | 1022 | 216 | 21.14% | 541 | 52 | 9.61% |
| 2026-04 | 1177 | 303 | 25.74% | 576 | 81 | 14.06% |
| 2026-05 | 1237 | 343 | 27.73% | 585 | 73 | 12.48% |
| 2026-06 | 1340 | 402 | 30.00% | 580 | 62 | 10.69% |
| 2026-07 | 1364 | 360 | 26.39% | 579 | 69 | 11.92% |
| 2026-08 | 1347 | 273 | 20.27% | 590 | 67 | 11.36% |
The gap widened over the past year
In August 2026, the single-family segment recorded 273 sales against 1,347 inventory, producing a calculated sales-to-inventory ratio of 20.27%. A year earlier, that ratio was 21.19%, based on 267 sales and 1,260 inventory.
Attached homes recorded 67 sales against 590 inventory, a ratio of 11.36%. In August 2025, 76 sales against 491 inventory produced 15.48%.
That means the single-family ratio declined by 0.92 percentage points, while the attached ratio declined by 4.12 points. The attached ratio was approximately 26.6% lower than its year-earlier reading.
This is a comparison of monthly sales with reported active inventory. It does not mean that 11.36% of a tracked group of attached listings sold, because the report does not follow a fixed listing cohort from start to finish.
Selling times tell a similar story
The median days on market for sold single-family luxury homes declined from 15 to 12. For attached luxury homes, it increased from 21 to 26.
Those movements matter together. The detached segment had slightly more sales and a shorter reported median selling time. The attached segment had fewer sales and a longer median selling time, alongside a substantial increase in available inventory.
Neither pattern describes every property. A carefully priced attached home can outperform its segment. A detached home with few close substitutes can still struggle if its condition or asking price limits its buyer pool. The data establishes different segment conditions, not a guaranteed outcome for an individual listing.
What sellers should compare before choosing a price
A useful pricing conversation begins with property type, then narrows to price range, location, size and condition. A seller of a luxury attached home should ask how many comparable units are available and which have actually sold. A seller of a detached home should make the same comparison within the property's competitive set.
The practical research question is: how much competing inventory must this property outperform?
That question also helps buyers. A broad claim that Nashville luxury is balanced can conceal a segment where available choices have increased faster than completed transactions. Buyers should investigate those choices without assuming that every seller will accept a substantial discount.
The report provides a reason to investigate property type early in the process. It does not support applying one citywide negotiating rule to both segments.
Study design and limitations
Original calculations from the supplied ILHM Luxury Report, Nashville, September 2026, pages 2–5. The PDF does not specify its precise Nashville geographic boundary. Its figures should not be merged with Nashville city or the Greater Nashville REALTORS nine-county totals. Report classification thresholds are buyer below 12%, balanced from 12% to below 21%, and seller at 21% or higher. Ratios above use unrounded counts.
Data, sources and reproduction
This article analyzes published aggregates. It is not a listing-level MLS export. Download the input rows used for the study and read the research methods for definitions, formulas and exclusions. The ILHM source is the supplied Nashville September 2026 report, pages 2–5; the publisher link identifies the report provider.
Cite this research
Ashton, Gary. “Nashville luxury: two property types, two different markets.” Nashville Homes, September 26, 2026. https://nashvillehomes.co/research/nashville-luxury-market-split/ Market period: August 2026, compared with August 2025.
Sources & further reading
Your next chapter
Let’s make it
a good move.
Bring your questions. Start a conversation with Gary’s team.