
What does the research show?
A Nashville home listed at $1.1 million and one listed at $3 million both qualify as luxury under the Institute for Luxury Home Marketing's single-family threshold. August's sales and inventory figures suggest they faced very different competitive conditions.
An original regrouping of the Institute's published price bands reveals three distinct levels of sales activity relative to inventory.
These groups combine whole source bands. Sales and inventory are summed separately before division, avoiding the error of averaging percentages from differently sized groups.
| Single-family price group | Inventory | Monthly sales | Sales divided by inventory |
|---|---|---|---|
| $900,000 to $1,299,999 | 350 | 120 | 34.29% |
| $1,300,000 to $2,199,999 | 508 | 97 | 19.09% |
| $2,200,000 and above | 489 | 56 | 11.45% |
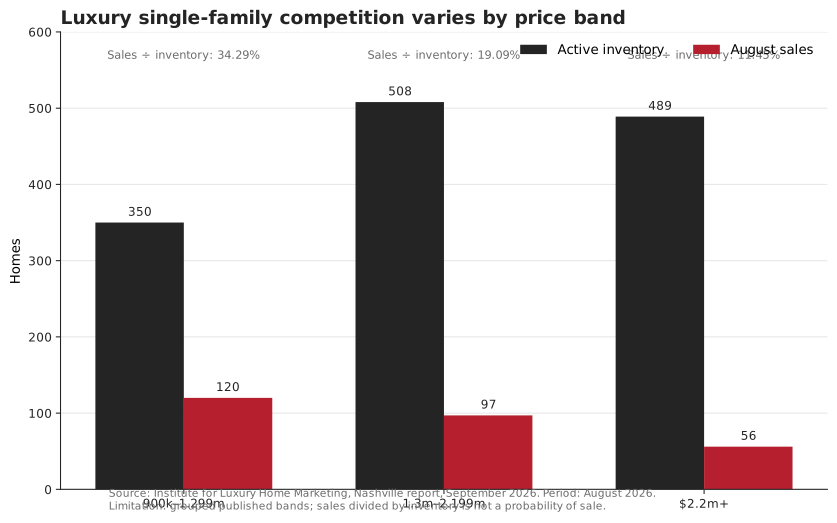
One overall label conceals three classifications
Applying the Institute's classification rules to these newly aggregated groups produces a seller-market ratio in the lowest group, a balanced ratio in the middle group and a buyer-market ratio in the highest group.
The overall single-family luxury ratio was 20.27%. That blended figure describes the combined pool, but it obscures the variation within it.
Sales relative to inventory in the lowest group were almost three times the level in the highest group. That comparison concerns activity relative to supply, not a property's probability of selling or the number of offers it will receive.
The busiest band was not the least expensive one
The report's $1.2 million to $1,299,999 band recorded 29 sales against 73 inventory. Its calculated ratio was 39.73%, the highest of the published single-family bands.
That finding complicates a simple claim that demand becomes weaker at every successive price level. Buyers' preferences, the available properties and the number of transactions can produce uneven results within the broader pattern.
It also argues against treating a bracket boundary as a pricing trick. The data does not prove that reducing a home from $1.31 million to $1.29 million improves its outcome. The groups contain different houses, and the report does not track what happened to individual properties after price changes.
How to use the finding in a pricing discussion
For a seller, the relevant question is whether the property's competition resembles the market described by its actual price band. How many competing homes offer similar land, construction quality, age and usable space? Which have sold, and which remain available?
For a buyer, the figures suggest where a broader selection of competing inventory may warrant closer investigation. They do not establish a standard discount. A listing can be priced well even when its segment's sales ratio is low.
The most useful next research step would follow listings through their price changes and eventual outcomes. That would show whether initially overpriced homes migrated between bands, whether concessions altered the effective sale price and how new construction affected each group.
For now, the evidence supports a narrower but valuable conclusion: Nashville's single-family luxury market cannot be described adequately with one sales-to-inventory ratio.
Study design and limitations
Calculated from the supplied ILHM Luxury Report, Nashville, September 2026, page 2. The $1.3 million and $2.2 million breaks are analytical groupings aligned with the published bins, not statistically estimated turning points. August is a single month; upper bands contain relatively few sales. The report's geographic boundary is unspecified.
Data, sources and reproduction
This article analyzes published aggregates. It is not a listing-level MLS export. Download the input rows used for the study and read the research methods for definitions, formulas and exclusions. The ILHM source is the supplied Nashville September 2026 report, pages 2–5; the publisher link identifies the report provider.
Cite this research
Ashton, Gary. “Nashville luxury has three different price-band markets.” Nashville Homes, September 26, 2026. https://nashvillehomes.co/research/nashville-luxury-price-bands/ Market period: August 2026.
Sources & further reading
Your next chapter
Let’s make it
a good move.
Bring your questions. Start a conversation with Gary’s team.