
What changed when we moved from headlines to listing records?
A single Nashville price headline cannot answer three different decisions: whether an unsold property has been repriced, where a defined home search has options, or how completed luxury sales were distributed across marketing times. This edition uses the fields behind those decisions rather than treating regional averages as a property valuation.
The starting package contains 21,721 records in ten files. We match the source and listing identifier to check duplicates, then restrict this edition to the 21,715 Realtracs records. Six records from other MLS sources are outside this study. The counts refer to listing records, not proven unique properties, households or Gary’s own transactions.
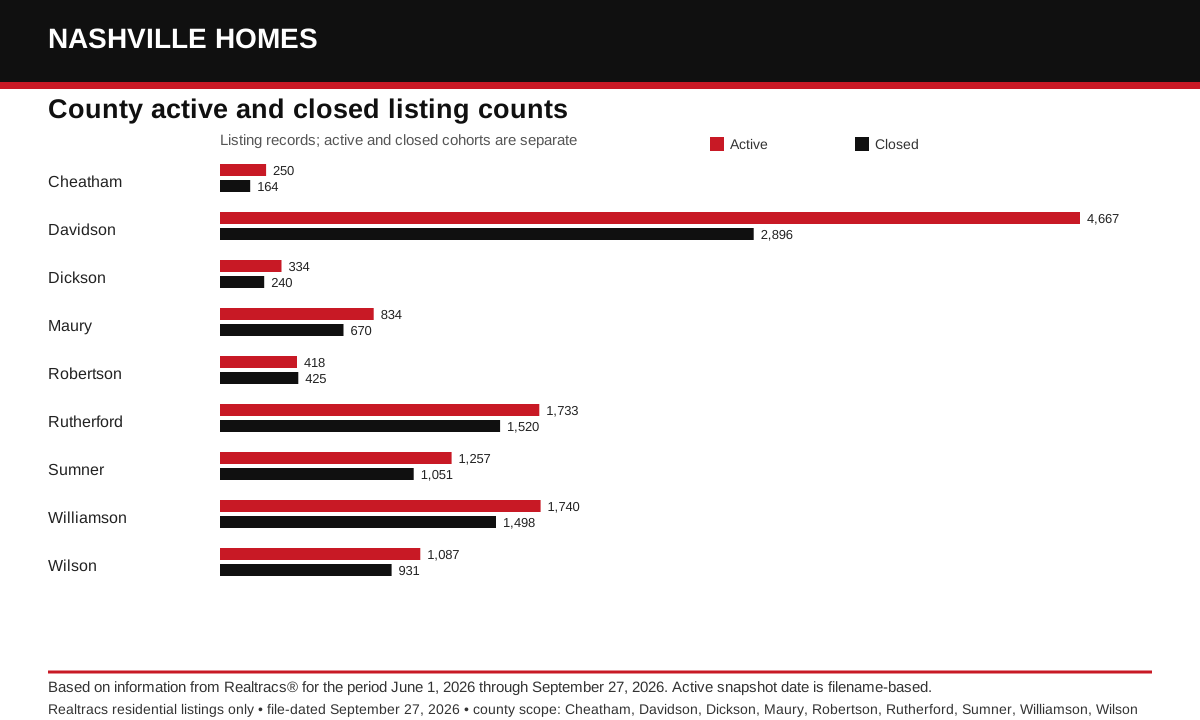
The nine-county sample, with prices kept in their own cohorts
The count columns include auction records. Asking- and sale-price medians exclude auctions and unusable prices; their denominators are shown separately. Active asking prices describe homes still listed, while completed sale prices describe different homes that closed earlier. Subtracting these two medians would not measure a negotiated discount.
| County | Active records | Ask-price n | Median ask | Jun–Aug closed | Sale-price n | Median sale |
|---|---|---|---|---|---|---|
| Cheatham | 250 | 248 | $442,172 | 164 | 162 | $391,500 |
| Davidson | 4,667 | 4,651 | $525,000 | 2,896 | 2,875 | $484,140 |
| Dickson | 334 | 334 | $412,500 | 240 | 240 | $384,950 |
| Maury | 834 | 832 | $489,450 | 670 | 669 | $425,000 |
| Robertson | 418 | 412 | $436,650 | 425 | 415 | $379,990 |
| Rutherford | 1,733 | 1,696 | $480,000 | 1,520 | 1,456 | $435,450 |
| Sumner | 1,257 | 1,249 | $475,000 | 1,051 | 1,042 | $459,995 |
| Williamson | 1,740 | 1,738 | $1,148,000 | 1,498 | 1,493 | $995,000 |
| Wilson | 1,087 | 1,081 | $542,650 | 931 | 909 | $515,000 |
Three decisions the data can help you make
Repricing: 5,278 of 12,239 eligible active records have a current asking price below their original asking price. The relevant next question is how a specific property compares with its current alternatives.
Budget search: 1,688 active records meet the exact three-bedroom, at-least-two-full-bath, Site Built and under-$500,000 asking-price definition. That is a repeatable search basket, not a guarantee of current availability or monthly affordability.
Luxury timing: the export contains 1,380 eligible closings at $1 million or more and a separate 2,289 active listings at that asking-price level. The timing study shows marketing-day distributions by price band; it does not convert those counts into a sale probability.
How should buyers and sellers use this briefing?
Choose a comparison group before choosing a conclusion. A county is a useful first filter, but properties still differ in subtype, size, age, condition, site, association obligations and location. The Williamson County median is not a Franklin neighborhood valuation; Davidson County includes places well beyond downtown Nashville.
For a buyer, use the research to narrow questions and then verify the current status and costs of actual homes. For a seller, use the appropriate price band and property comparables to prepare a pricing and timing discussion. Neither a county median nor the share of repriced listings tells you which offer to accept.
What this edition cannot establish
The exports do not include pending listings, a complete price-change history, or a year of closed sales. The export filters and any result cap have not been confirmed. Accordingly, this edition does not report year-over-year trends, official inventory totals, months of supply, a forecast, or a team market-share claim.
Two unusually low values, a $295 original asking price and a $1,700 sale price, cannot be explained from the supplied numeric fields. They are quarantined only from metrics that use those fields. We do not remove expensive listings or long marketing times simply because they are unusual. Separate samples and a single snapshot also cannot tell us whether a price reduction caused a home to sell.
Source, calculations and next edition
Based on information from Realtracs® for the period June 1 through August 31, 2026 (closed sales), and active exports dated September 27, 2026. The active date comes from filenames; the extraction timestamp and search filters have not been independently confirmed.
Price medians use non-auction records with a price of at least $10,000 in the field being measured. No upper-price cutoff is applied. County counts retain all included records. A median is the middle observation; it is not the average of county medians. The downloadable table provides each county’s count and usable-price denominator.
The next edition will retain these definitions so changes can be interpreted. A confirmed export specification and longer closed-sale history would allow us to distinguish sample changes, seasonality and market movement.
Cite this research
Ashton, Gary. “Nashville market briefing: September 2026.” Nashville Homes, September 28, 2026. https://nashvillehomes.co/research/september-2026-market-briefing/ Active files dated September 27, 2026; closed sales June 1–August 31, 2026.
Sources & further reading
- Nashville Homes September 2026 MLS research: source scope and methods checked 2026-09-28
- Realtracs: definitions of DOM, LTC and CTC checked 2026-09-28
- Realtracs broker resources and current rules checked 2026-09-28
Your next chapter
Let’s make it
a good move.
Bring your questions. Start a conversation with Gary’s team.