
What does the research show?
An increase in Nashville's housing inventory does not mean every local market is changing in the same way. A comparison of 15 ZIP codes displayed in Realtor.com's Nashville price table reveals substantial differences in both inventory growth and reported days on market.
Thirteen of the 15 ZIP codes showed higher active inventory than a year earlier. Yet seven of those 13 also showed shorter median days on market. Additional supply and faster reported market time were occurring together in more than half of the inventory-growing ZIPs in this selected sample.
The sample is the 15 ZIPs in the page's price table, not every Nashville ZIP code. Each ZIP's own summary was checked for the comparison.
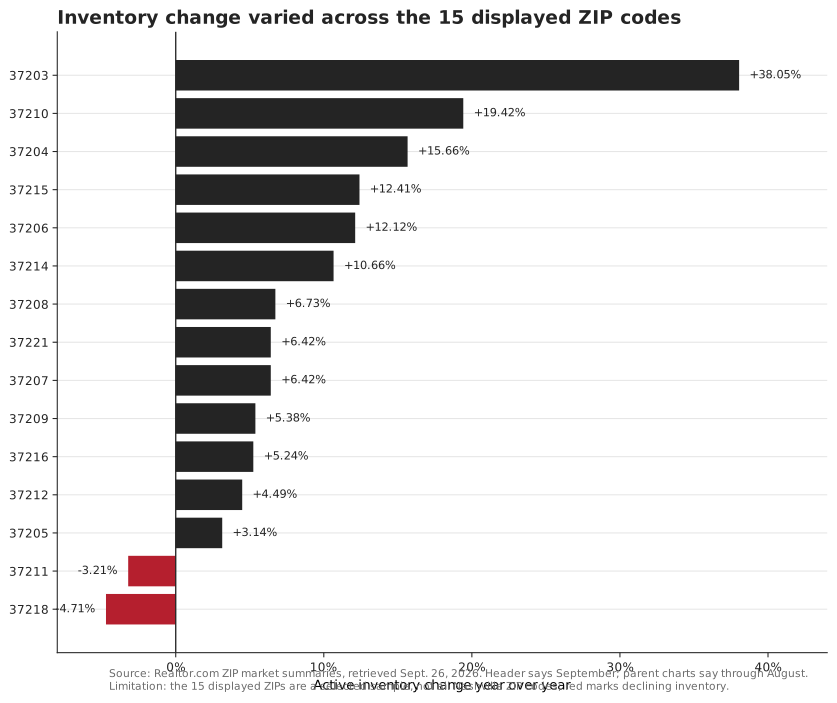
The full 15-ZIP inventory and market-time sample
This table keeps the source’s annual-change fields with each ZIP. The 37204 individual summary supplies its 81-day DOM. Quarantined sold-price observations are not included. ZIP boundaries do not define neighborhoods, and a count of ZIP directions is not a weighted city statistic.
| ZIP | Active listings | Inventory YoY | Median DOM | DOM YoY |
|---|---|---|---|---|
| 37203 | 423 | 38.05% | 82 | -0.59% |
| 37204 | 178 | 15.66% | 81 | 7.32% |
| 37205 | 253 | 3.14% | 80 | 4.14% |
| 37206 | 275 | 12.12% | 74 | 9.84% |
| 37207 | 482 | 6.42% | 67 | 6.56% |
| 37208 | 312 | 6.73% | 74 | 7.90% |
| 37209 | 503 | 5.38% | 71 | -2.90% |
| 37210 | 168 | 19.42% | 75 | -5.16% |
| 37211 | 457 | -3.21% | 66 | 10.74% |
| 37212 | 167 | 4.49% | 82 | -2.33% |
| 37214 | 213 | 10.66% | 52 | -11.86% |
| 37215 | 285 | 12.41% | 73 | 16.67% |
| 37216 | 216 | 5.24% | 63 | -13.11% |
| 37218 | 166 | -4.71% | 80 | -21.35% |
| 37221 | 301 | 6.42% | 64 | -16.25% |
Source: 37203 · 37204 · 37205 · 37206 · 37207 · 37208 · 37209 · 37210 · 37211 · 37212 · 37214 · 37215 · 37216 · 37218 · 37221
The biggest contrast involves two sizable listing pools
ZIP 37203 showed 423 active listings, up 38.05% year over year. ZIP 37211 showed 457, down 3.21%. Their inventory-growth readings were 41.26 percentage points apart.
Reversing the published growth rates implies approximately 117 additional listings in 37203 and approximately 15 fewer in 37211. These are estimates reconstructed from rounded percentages, not counts of newly listed properties. They describe the change in the reported inventory measure.
The two ZIPs had similar current listing counts but sharply different annual changes. That matters because the count of available alternatives and the direction of change answer separate questions. Neither establishes how many homes satisfy an individual buyer's requirements.
Sources: 37203 and 37211.
More inventory did not always mean longer marketing periods
Sources: Realtor.com Economic Research summaries for 37214, 37216, 37221 and 37206.
These comparisons do not explain why the measures changed. A different mix of listings, different transaction volumes or changes in the types of homes available could affect the results. The summaries do not supply the listing histories needed to separate those possibilities.
They do show why a citywide inventory headline is an incomplete guide to local negotiating conditions.
| ZIP code | Active inventory change YoY | Median days on market | Days on market change YoY |
|---|---|---|---|
| 37214 | +10.66% | 52 | -11.86% |
| 37216 | +5.24% | 63 | -13.11% |
| 37221 | +6.42% | 64 | -16.25% |
| 37206 | +12.12% | 74 | +9.84% |
Use the ZIP as a starting point
A buyer can use these differences to choose where to investigate current options, then narrow the comparison by price, property type, size, condition and preferred location. A ZIP with growing inventory may still have very few homes meeting those requirements.
A seller should identify the subset of listings that buyers are likely to compare with the property. If the closest alternatives are selling faster, a broad story about rising Nashville supply may offer little guidance for setting the asking price.
The useful question is not simply whether inventory increased. It is whether the relevant competition increased, what happened to comparable listings and how the property's offering fits that evidence.
Source: Realtor.com Economic Research
Study design and limitations
This is an original cross-sectional comparison of public aggregates, with unweighted counts of ZIP directions. It is not a transaction-weighted Nashville index. ZIP boundaries are not neighborhood boundaries. Period-label ambiguity is retained rather than presenting the data as a finalized September release. Definitions and the full sample are in the accompanying research files. Data attribution: Realtor.com Economic Research.
Source: Realtor.com Economic Research
Data, sources and reproduction
This article analyzes published aggregates. It is not a listing-level MLS export. Download the input rows used for the study and read the research methods for definitions, formulas and exclusions.
Cite this research
Ashton, Gary. “Nashville inventory is rising unevenly across ZIP codes.” Nashville Homes, September 26, 2026. https://nashvillehomes.co/research/nashville-zip-inventory-divergence/ Market period: Snapshot retrieved September 26, 2026; source charts through August.
Sources & further reading
- Realtor.com Nashville and ZIP market summaries: snapshot retrieved September 26, 2026 checked 2026-09-26
- Realtor.com Economic Research data definitions checked 2026-09-26
Your next chapter
Let’s make it
a good move.
Bring your questions. Start a conversation with Gary’s team.